Using Celery.2DGraphItemSelector in Dynamo
Since I cannot produce a YouTube tutorial on how to use Celery’s 2DGraphItemSelector due to some hindrances in my surroundings, I rather post a blog to explain its usage. Sorry to keep you waiting for too long.
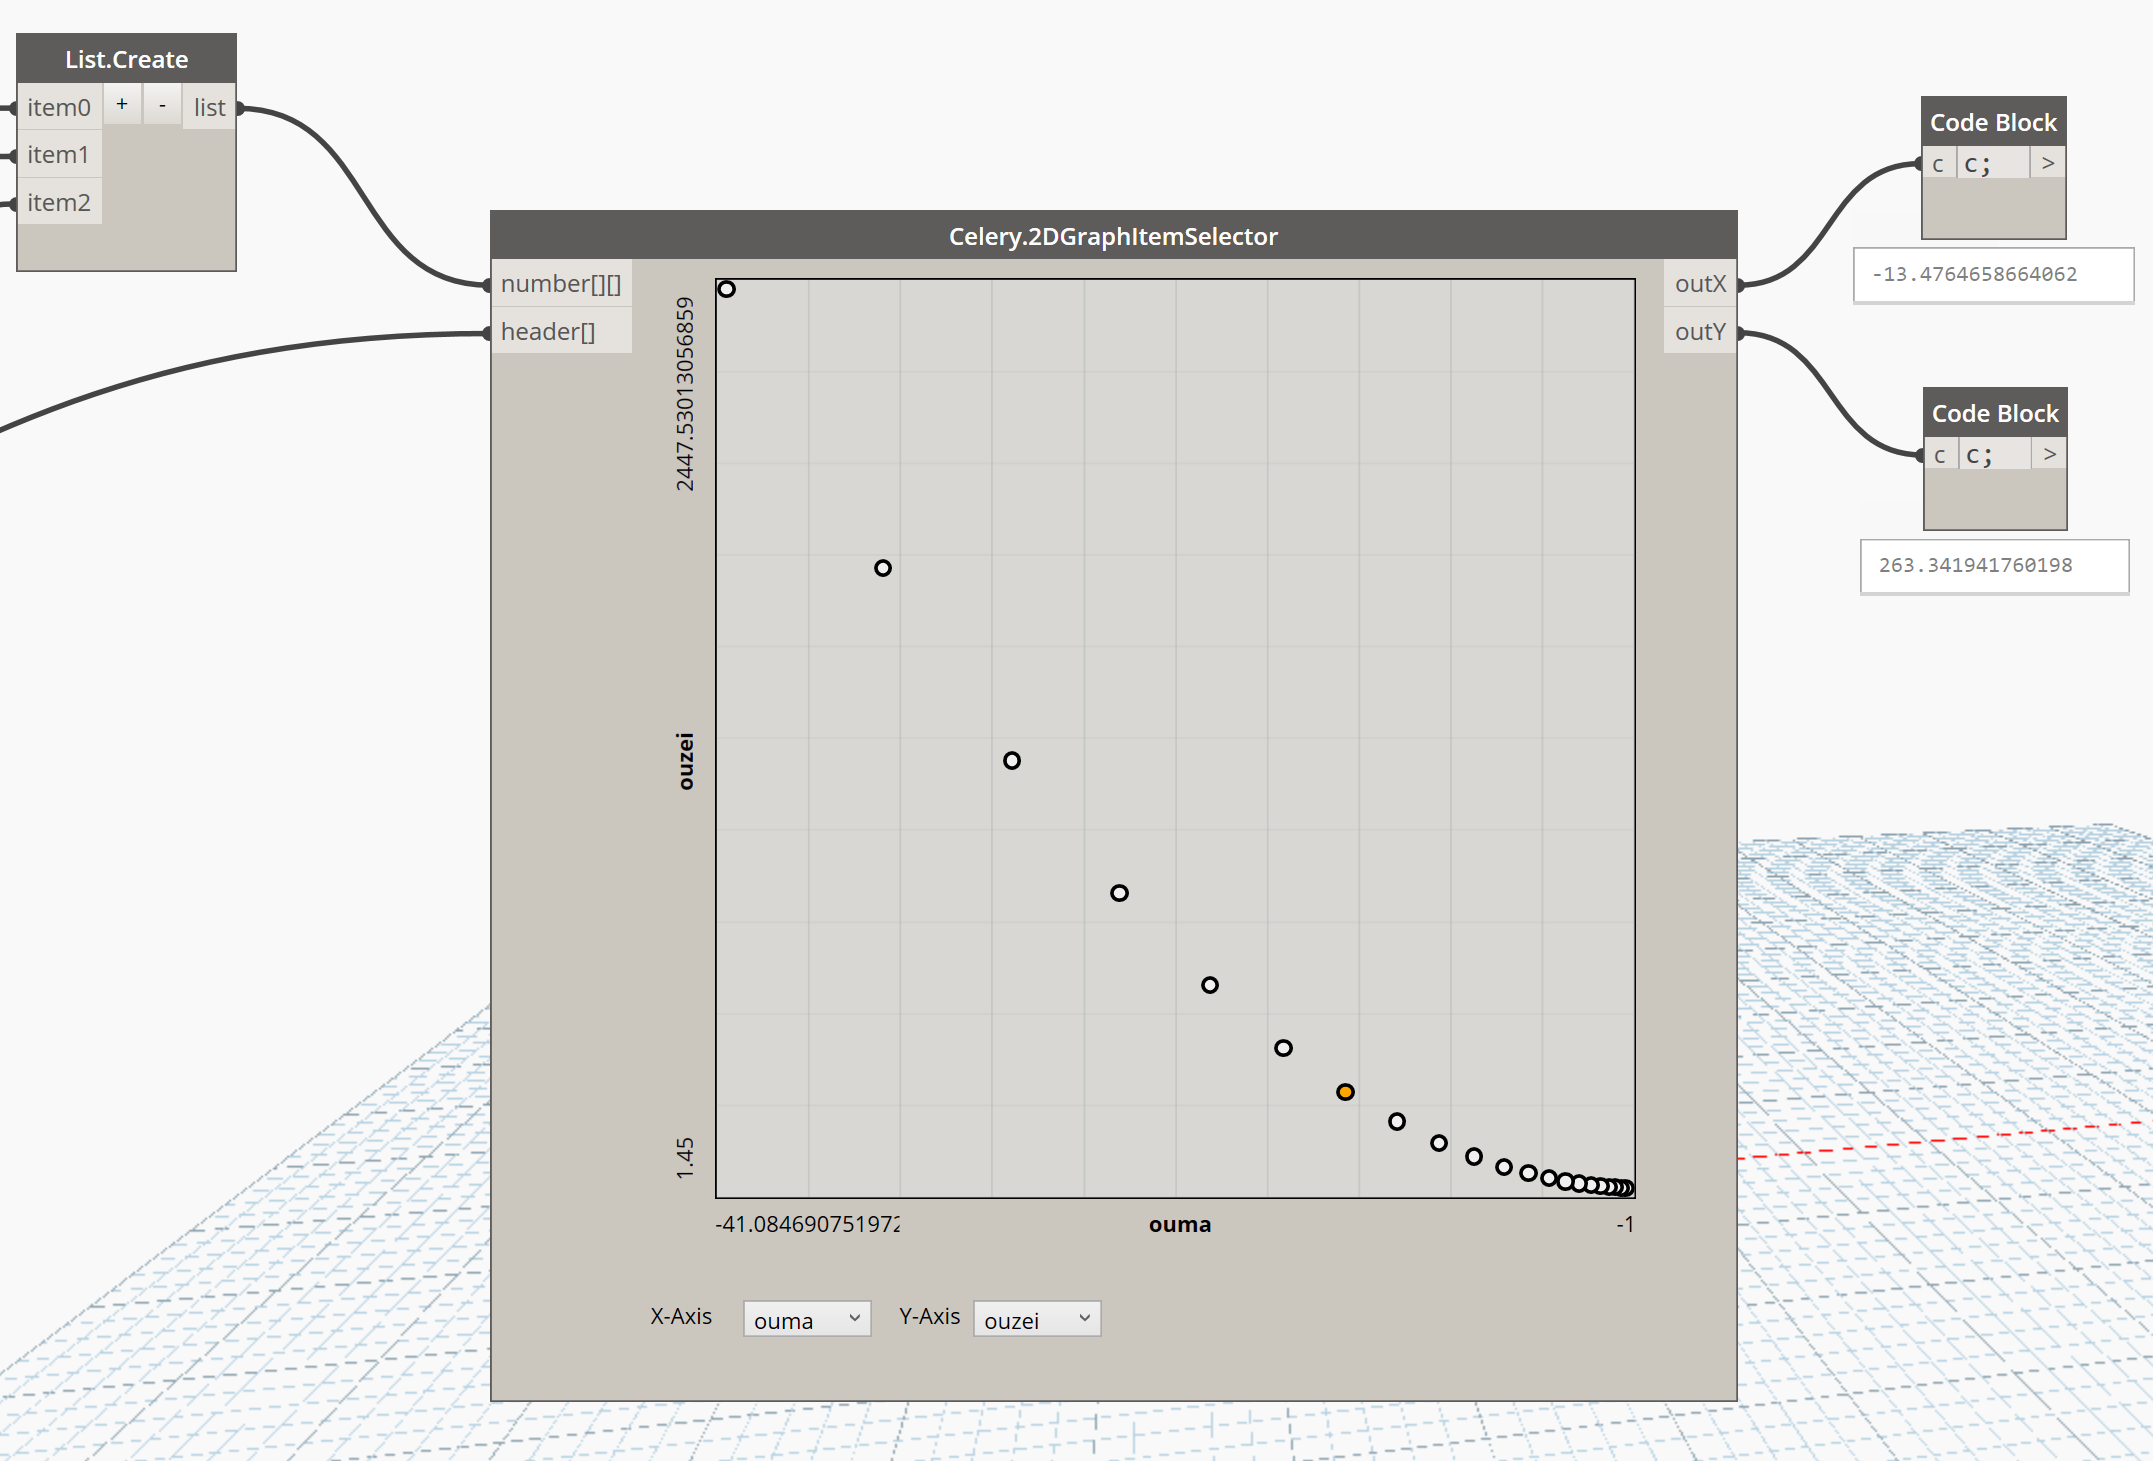
Anyway, as you can see in this node, there are two inputs and two outputs. The first of the two inputs expects a two-dimensional list of numbers; that means a list of lists of numbers. The second input is a list of string as headers that will be shown in the node through the two combo boxes. The number of lists connected to the input must the equal to the number of headers, and the headers must match the corresponding list of numbers they represent.
In this example I created three sets of numbers generated by number series. The first set is a simple sequence of numbers from 1 to 20, the second set contains the values of the equation x^2 where x is the set of numbers from the first set. The last set is the logarithmic values of the numbers in the first set to base 10.
So we also need to create a list of three headers for these sets of numbers. Let us name them “linear”, “squared”, and “log10”.
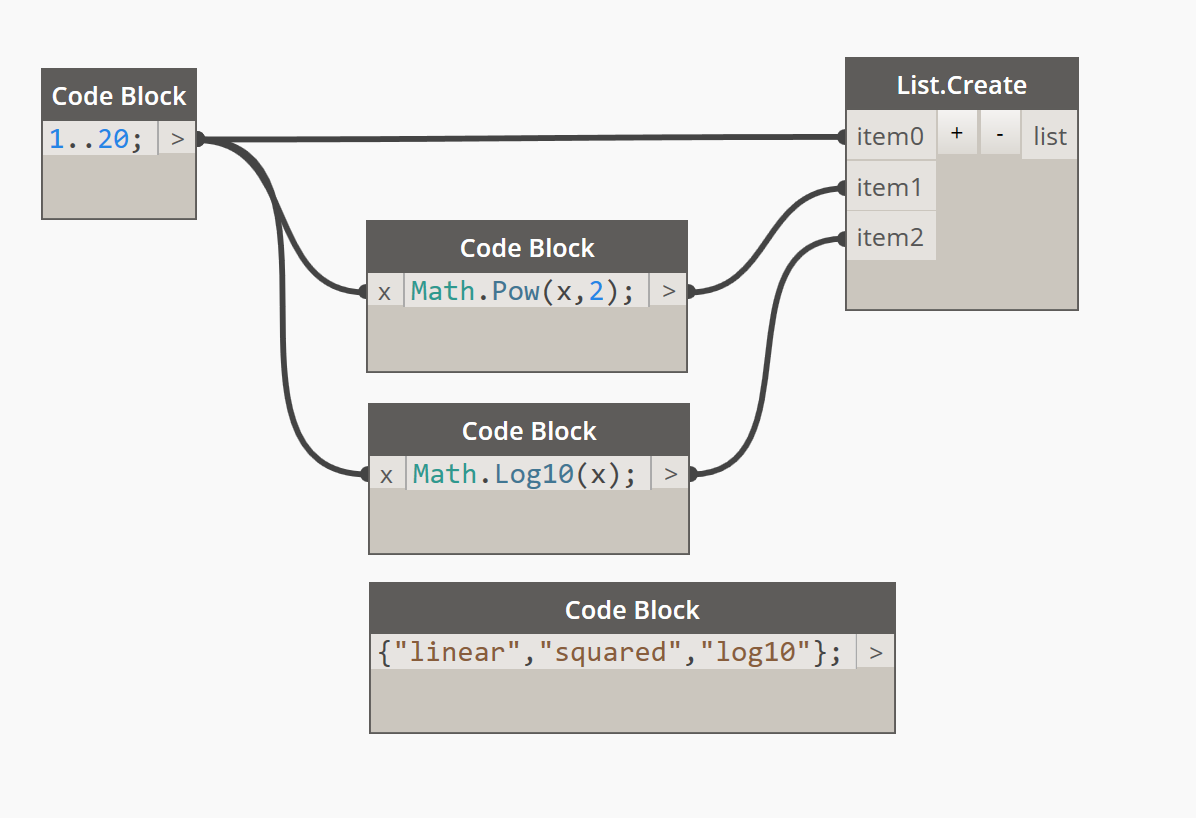
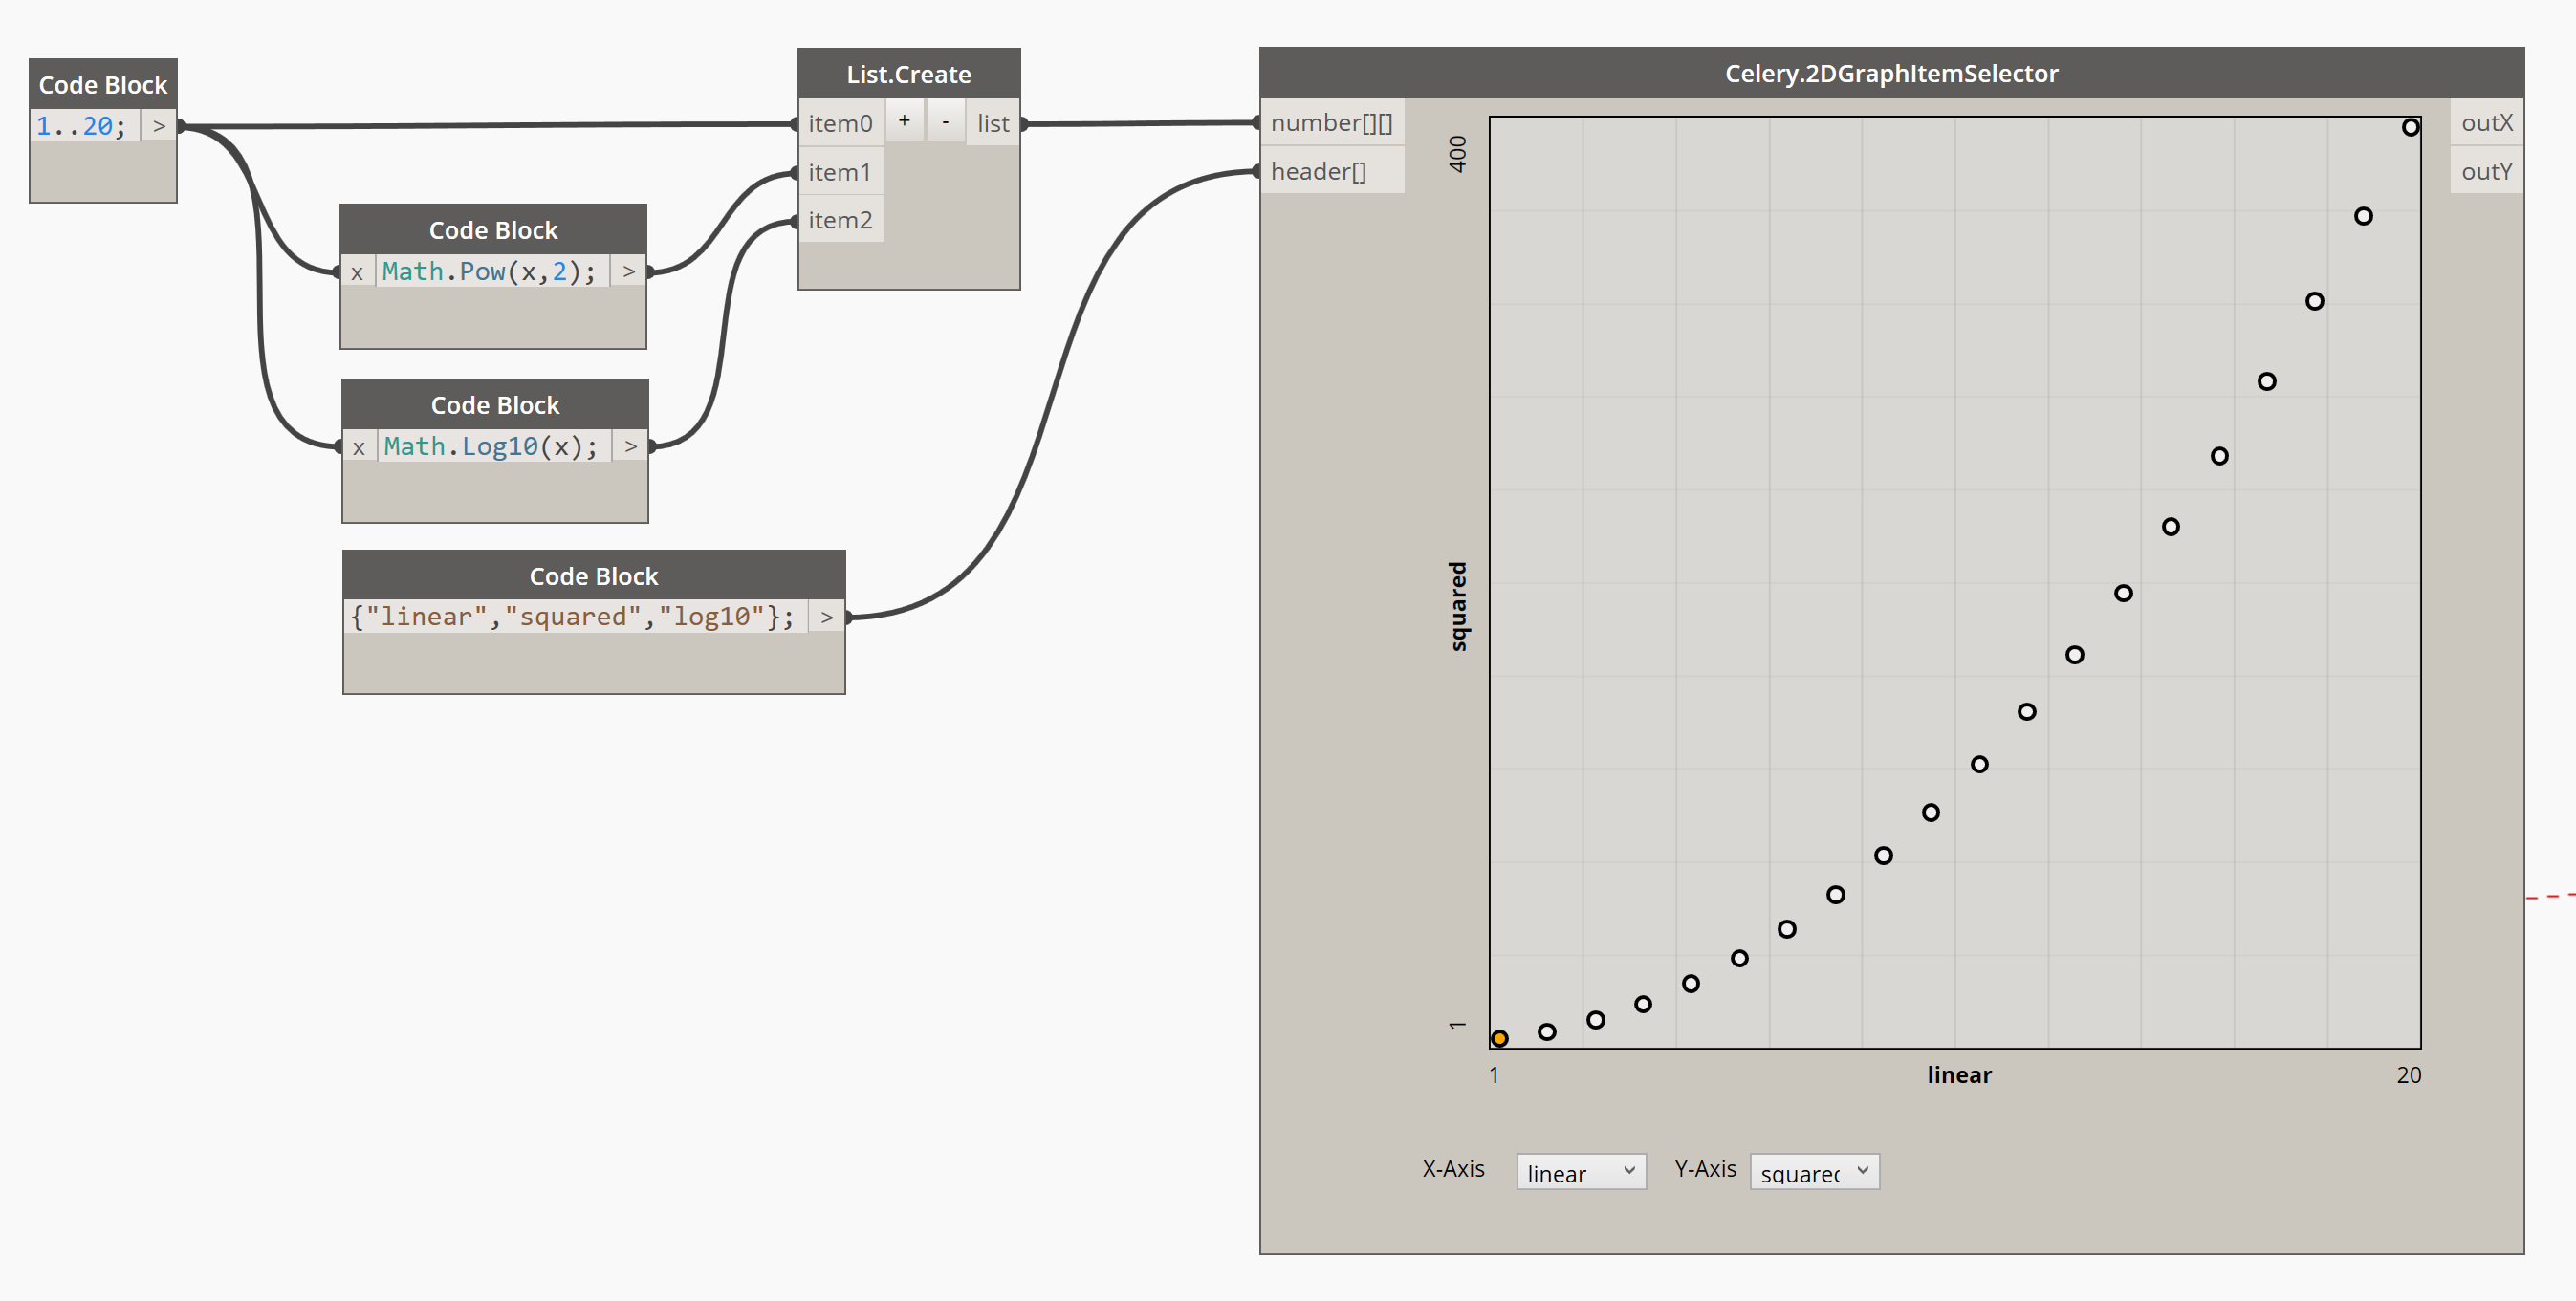
Connect this number series to the number[][] input with the help of List.Create node, and the headers to the header[] input.
Once everything is connected, the graph automatically generates graphical points, each representing the set of numbers at each assigned index, and their positions in the graph will depend on the headers set in both X-axis and Y-axis. (As of this writing I discovered a bug wherein the combo box does not respond very well in Dynamo Studio, so I will be posting an update of Celery soon.)
The graph will also determine the minimum and maximum values in each axis, and it shall become the bounds for each axis. They will also be shown in the graph for reference. Also, try to change the X-axis and Y-axis headers using the combo boxes at the bottom part of the node. The graph should respond to the selected headers as well as the limits and axis headers.
To know what are the values that each point represents in this 2D graph, hover over a point in the graph, and to get its values into the outputs, just click on the point, and the output ports will obtain the X and Y values each. These values shall be used for further checking and more extensive operations succeeding this node.
The Best Application
Now, the bottom-line of the usage of this node is, where is it applied?
If you are familiar with the Optimo package in Dynamo, the NSGA II node has an output of two-dimensional list of numbers, but we have to do something in order to pick the better values we need from this result. While it is obvious that the first items represent the best answer the NSGA II node offers, oftentimes we need options, and those options will come from another set of values coming from the NSGA II node. So how would we know easily what values will satisfy the criteria we have? Here is where 2DGraphItemSelector comes in.
If you have Optimo installed, try to open Optimization Example-02-SCH.dyn file from the Optimo example files.
Create a new Celery.2DGraphItemSelector node and position it just after the code block node that has an a[1] value in it (after the LoopWhile node). Try to connect this node to the NSGA II node in one of the existing samples from Optimo, and add a code block that contains a list of three strings (in this example, it is “X”, “Y” and “Z”). Connect the code block of numbers and headers to the proper inputs, and see for yourself.
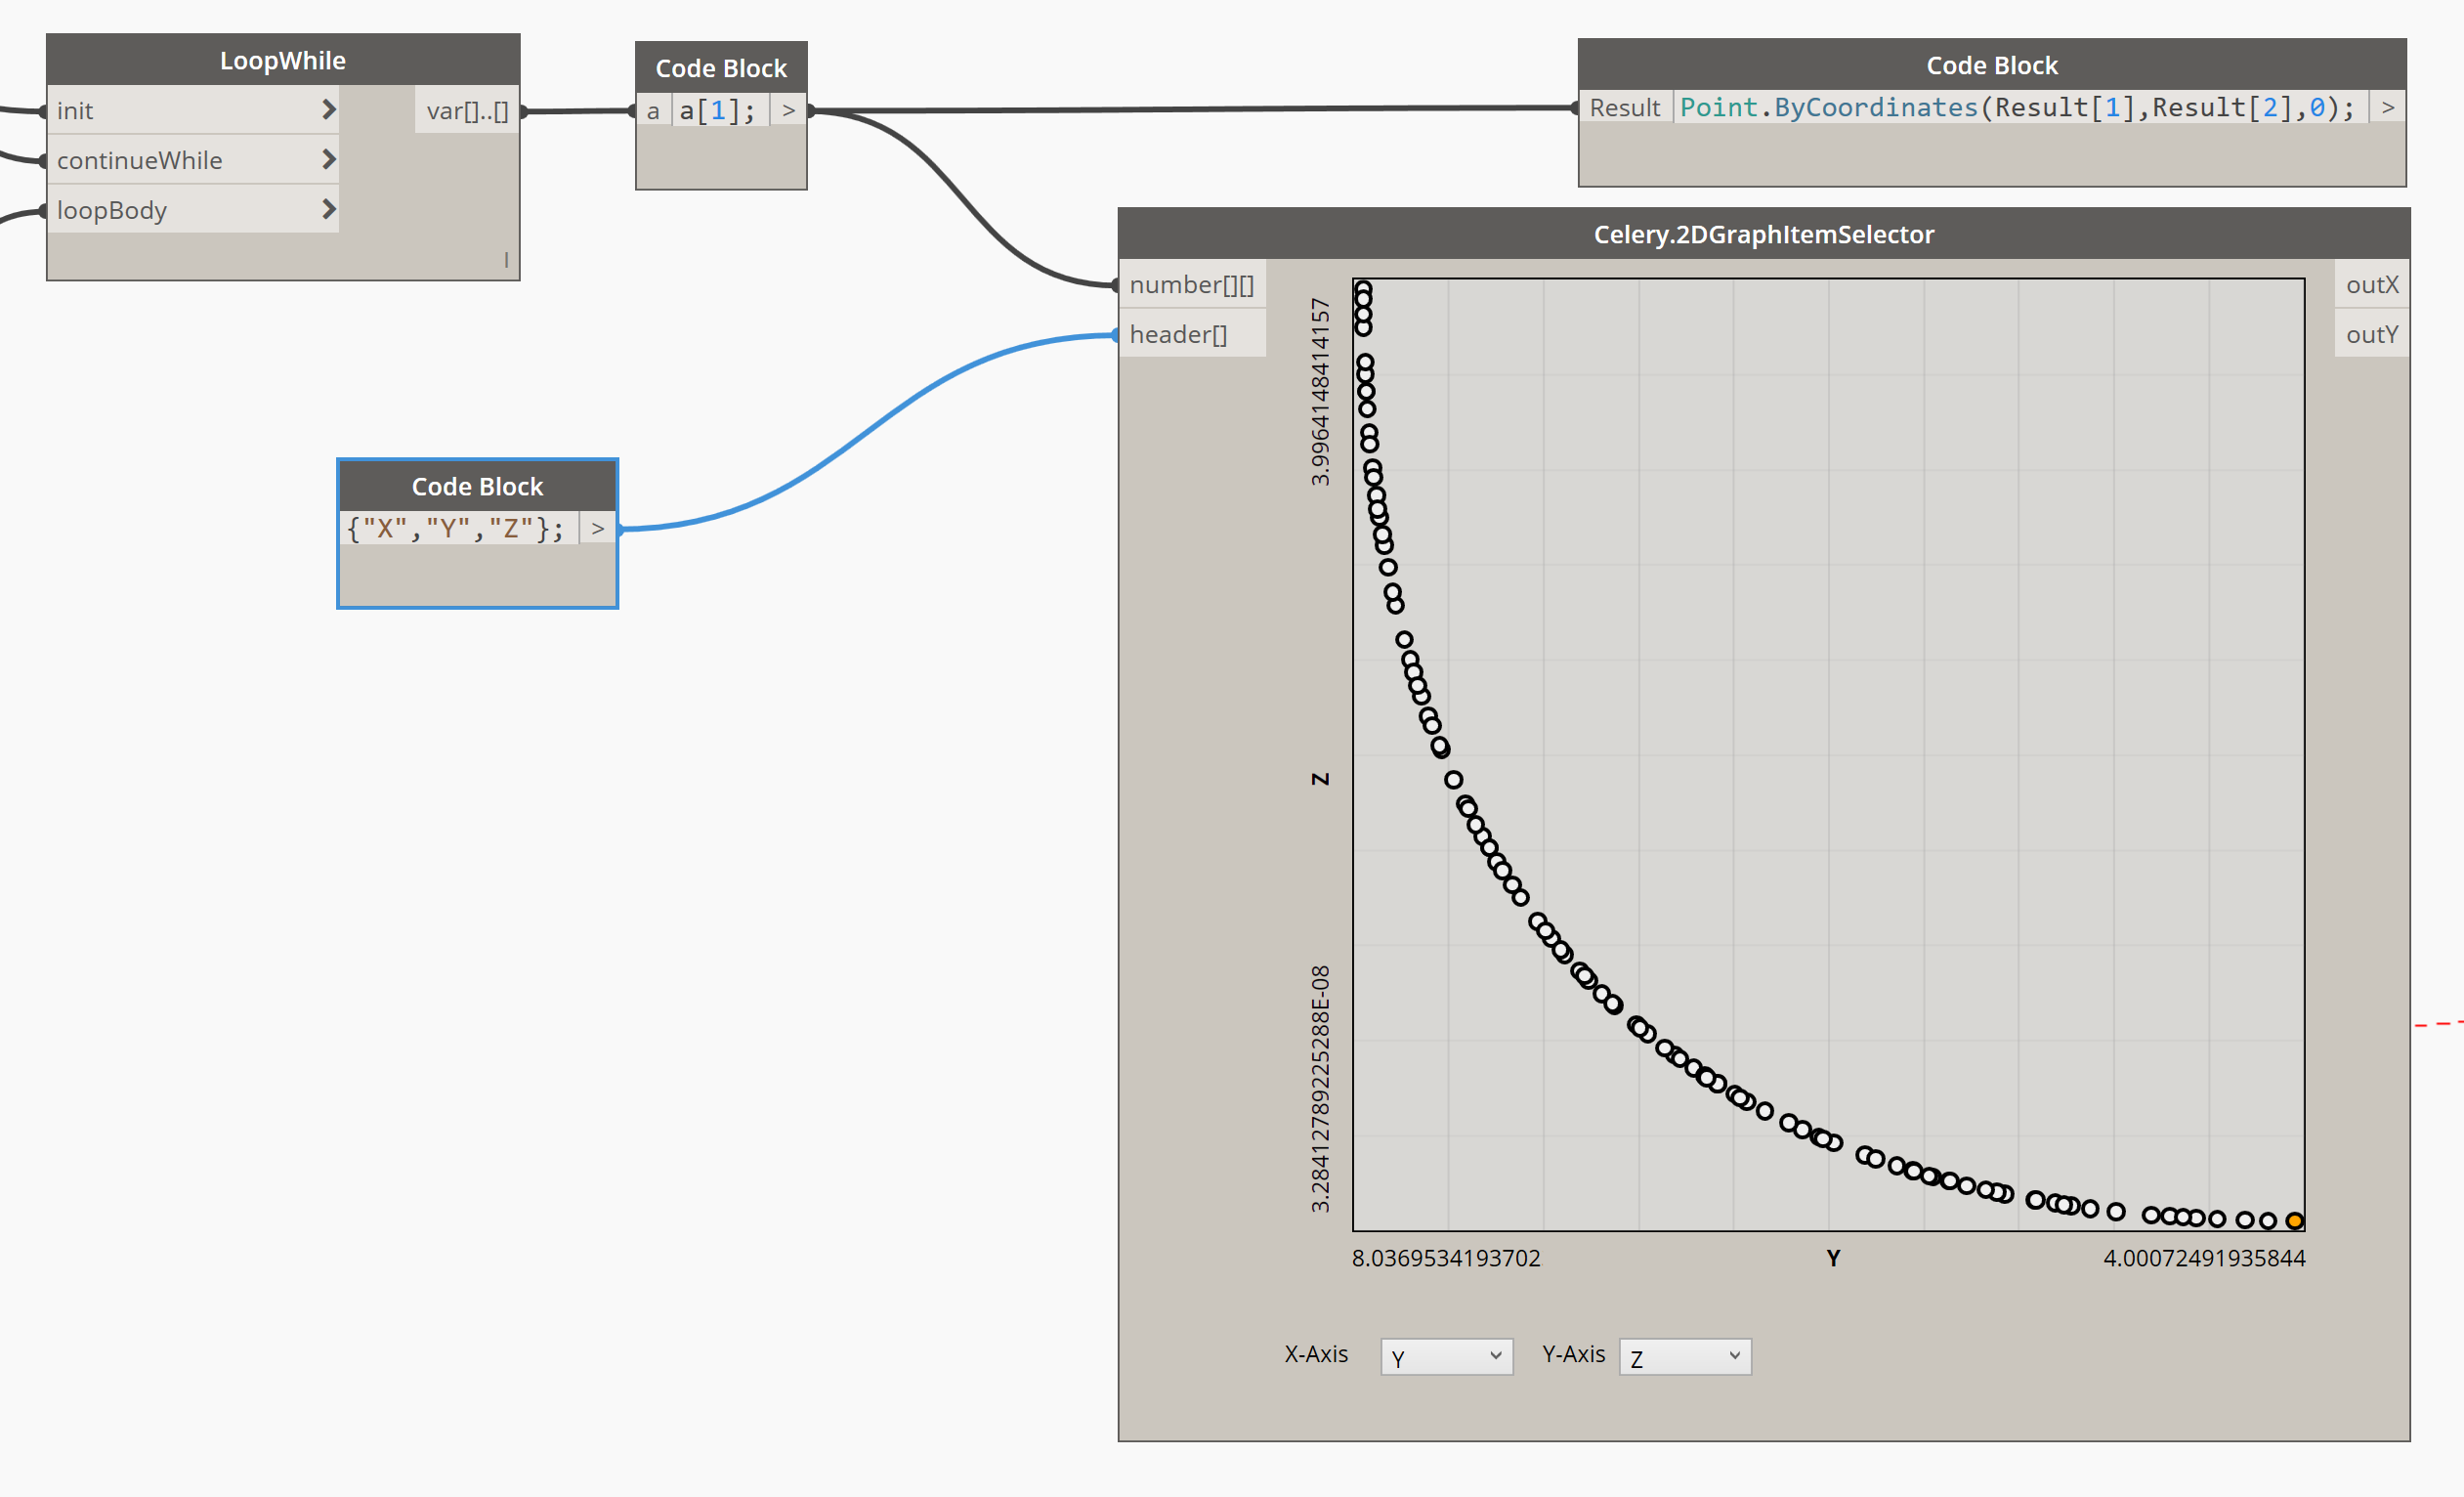
Be noted, however, that when reinstating the solution to a custom node (that represents an objective) that produces geometry or model changes in Revit, you need to add a new node of that objective and connect the outX and outY ports to the missing inputs of the objective node. This will eventually reveal the result of the model whenever you select a point from the graph node.